
Last Updated: July 16, 2026
Purity and potency measure entirely different aspects of peptide quality. Purity is the percentage of your sample that is the intended peptide; potency is how biologically active that peptide actually is. A peptide can be 99% pure yet have low potency if the molecules are structurally degraded or misfolded. Conversely, slightly lower absolute purity might retain excellent potency if impurities don’t interfere with biological function.
Peptide purity is the percentage of your sample consisting of the correctly synthesized target peptide, measured by HPLC (high-performance liquid chromatography). A 95% pure peptide means 95% of sample weight is the desired compound and 5% is synthesis byproducts, degradation fragments, salts, or other contaminants. The metric is straightforward, but it masks complexity: a 95% pure peptide might contain one dominant byproduct or multiple trace contaminants, each with different functional consequences.
Peptide potency measures biological activity or effectiveness in performing its intended function, expressed as a percentage of theoretical maximum activity or as binding affinity and receptor activation. Unlike purity, potency cannot be determined by chromatography alone, it requires functional assays testing whether the peptide achieves its intended biological effect. A degraded peptide might be pure (no contaminants) but have severely compromised potency due to structural damage.
HPLC separates peptides based on chemical properties, forcing a liquid sample through a column under high pressure. Different molecules travel at different speeds and exit at characteristic retention times. The detector measures abundance as each molecule elutes, producing a chromatogram where peak area indicates the amount of each molecular species. Purity is calculated by dividing the target peptide’s peak area by total peak area and multiplying by 100.
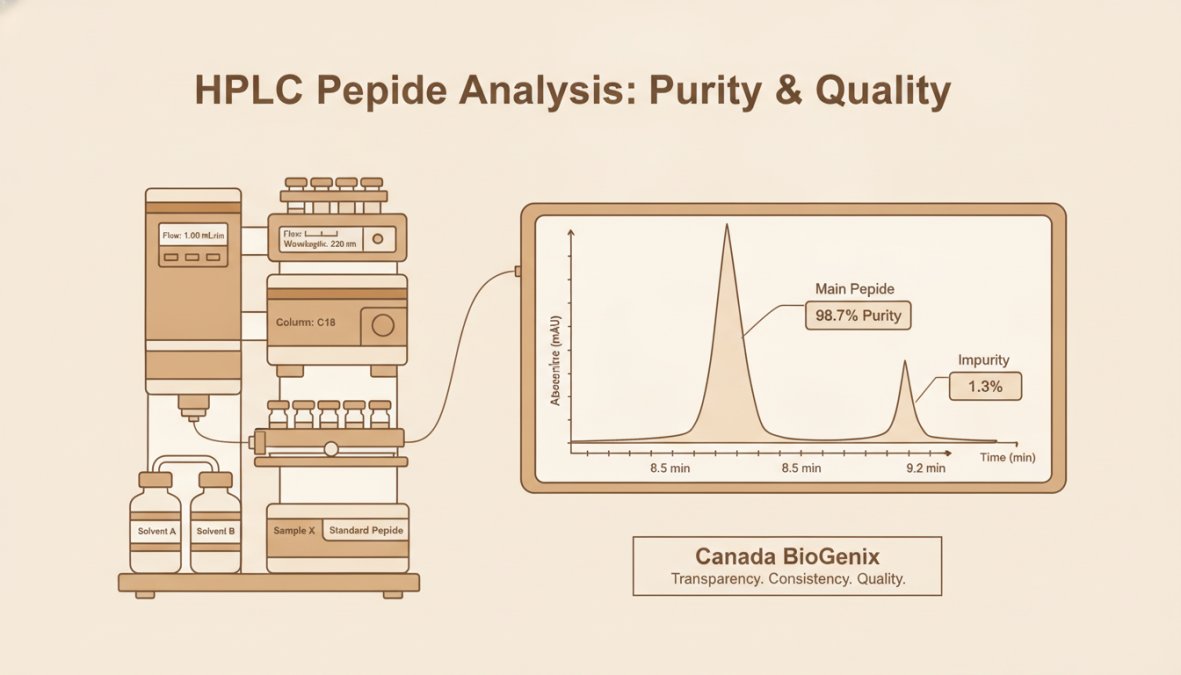
Retention time serves as a fingerprint for identity confirmation. If your peptide doesn’t elute at the expected time, something is structurally different. Certificates of Analysis always specify the expected retention time range. Peak area is proportional to the amount of each molecule present. When HPLC software integrates peaks, poor resolution can artificially inflate purity by incorrectly assigning impurity peaks to the target peak.
An impurity profile lists each detected peak, its retention time, and its percentage of total. Two peptides both reporting 97% purity could tell very different stories: one might have a single 3% impurity (suggesting a specific synthesis problem), while another has dozens of trace impurities under 0.5% each (suggesting general degradation). Understanding impurity profiles requires knowing the source of each peak, some are expected synthesis byproducts like n-terminal acetylation variants; others indicate problems like oxidation or contamination.
Common impurities include deletion sequences (missing amino acids), addition sequences (extra amino acids), and modified forms like oxidized methionine or deamidated asparagine. Degradation products form during storage: peptides can hydrolyze, oxidize (particularly methionine and tryptophan), or undergo racemization. Solvent residues and excipients like water, salts, or buffer components often constitute 5-10% of lyophilized powder samples.
Not all impurities reduce potency equally. A 2% deletion sequence might have minimal effect if it’s unlikely to bind your target receptor, but a 2% oxidation product could significantly reduce potency by disrupting three-dimensional structure. Impact depends on where the impurity sits in the sequence and its role in binding or activity. For screening assays, minor impurities might be acceptable; for dose-response studies or in vivo work, they become problematic.
A peptide reported as 95% pure by HPLC might deliver only 80 mg of actual peptide per 100 mg vial when accounting for water, salts, and other non-peptide mass.
HPLC purity measures the percentage of sample that is your target peptide molecule but doesn’t account for associated molecules like water or counterions. When a peptide is supplied as a salt (TFA, acetate, or HCl), the counterion adds significant mass. A peptide with molecular weight 1000 Da supplied as TFA salt might have total molecular weight 1150 Da. Your HPLC shows 95% purity, but that 95% includes the TFA counterion.
Net peptide content corrects for this by calculating peptide backbone mass alone, excluding counterions and water. If your vial contains 100 mg at 95% HPLC purity and the peptide is supplied as TFA salt with a correction factor of 0.85, your actual peptide content is 95 × 0.85 = 80.75 mg. This calculation is essential for accurate dosing. Without it, you’ll dose inaccurately and spend weeks troubleshooting before realizing the issue.
Excipients like mannitol, trehalose, and glycerol improve stability and solubility but reduce net peptide content. If your peptide is supplied with 10% mannitol by mass, your actual peptide content is 90% of reported mass, even if HPLC purity is 95%. Residual water from synthesis or purification can constitute 5-15% of lyophilized samples. The Certificate of Analysis should specify residual water content (loss on drying or LOD). If LOD is 8%, then 8% of sample mass is water, not peptide.
Research-grade peptides occupy a middle ground between crude synthesis and pharmaceutical-grade production. They’re more refined than bulk synthesis but don’t meet GMP (Good Manufacturing Practice) standards required for therapeutic use.
Pharmaceutical-grade peptides are manufactured under strict regulatory oversight with documented procedures for every synthesis and testing step. They meet USP or Ph.Eur standards and are suitable for clinical trials. Research-grade peptides are synthesized using validated methods and tested for identity and purity but aren’t manufactured under GMP. They’re appropriate for laboratory research and preclinical studies, with slightly higher batch-to-batch variability than pharmaceutical-grade material.
The distinction matters because research-grade peptides are cost-effective for screening and optimization, but if results transition to therapeutic development, you’ll eventually need pharmaceutical-grade material. Some researchers optimize with research-grade peptides only to discover pharmaceutical-grade versions behave differently due to stricter impurity limits or different salt forms.
A Certificate of Analysis documents that the peptide received matches what was ordered and meets quality specifications. It should include identity confirmation (typically mass spectrometry), purity analysis (HPLC), potency or activity data if applicable, and information about impurities, solvent residues, and water content. For research-grade peptides, the CoA typically includes HPLC chromatogram, mass spectrometry data confirming molecular weight, and a purity statement. Always request and review the full CoA before using a peptide.
Both metrics matter but answer different questions and require different analytical approaches.
| Metric | Measures | Method | Units | Why It Matters |
|---|---|---|---|---|
| Purity | Chemical composition | HPLC, MS | Percentage (%) | Confirms correct compound identity and absence of contaminants |
| Potency | Biological activity | Functional assay, binding assay | % activity, EC50, Kd | Predicts whether the peptide will work as intended |
| Net Peptide Content | Actual peptide mass | Calculation from CoA data | Milligrams (mg) | Ensures accurate dosing and reproducible results |
Purity is a quick, inexpensive quality control metric. Potency requires biological testing, which is more time-consuming and expensive. For screening work, purity alone is often sufficient. For dose-response studies or therapeutic applications, potency data becomes critical.
A high-purity peptide without potency data is a wild card, you know what you have chemically but not if it works. Potency measurement without purity data is difficult to interpret. The best practice is requesting both metrics: HPLC purity confirms you received the correct compound; potency data confirms it functions as expected.
Many suppliers advertise "99% purity" as exceptional quality. In reality, 99% purity is common for well-synthesized peptides under 30 amino acids. It’s standard, not exceptional. The problem is that 99% purity means very different things depending on what the remaining 1% actually is. A 99% pure peptide where 1% is a single deletion sequence is fundamentally different from one where 1% is distributed across dozens of trace contaminants.
Additionally, 99% purity doesn’t address net peptide content. A peptide that’s 99% pure but supplied as TFA salt with 10% water might deliver only 85 mg of actual peptide per 100 mg vial. The impressive number doesn’t reflect what you’re actually getting.
A peptide can be 98% pure and completely inactive if synthesized molecules are misfolded, oxidized, or structurally compromised. Purity measures absence of contaminants; it doesn’t measure whether the peptide itself is functional. A GLP-1 agonist peptide that’s 97% pure but has undergone partial oxidation during storage might be structurally intact enough to count as "pure" by HPLC but too damaged to bind its receptor effectively.
This is why potency testing is essential for any application where biological activity matters. Purity is necessary but not sufficient.
The Certificate of Analysis is your primary tool for verifying that received peptide meets specifications.
The CoA should include:
Identity confirmation: Typically by mass spectrometry, showing observed molecular weight matches theoretical weight. Deviation over ±2 Da suggests a synthesis error or contamination.
HPLC purity: The percentage of sample that is the target peptide, along with a chromatogram showing all peaks. Request the actual chromatogram image, not just the number.
Impurity profile: A table listing each detected impurity, its retention time, and its percentage of total.
Water content (loss on drying): Typically expressed as a percentage. Values above 10% suggest moisture absorption or suboptimal lyophilization.
Net peptide content or correction factor: Allows you to calculate actual peptide backbone mass in your vial. If not provided, ask for it.
Storage conditions and stability data: Information about recommended storage temperature and any known stability issues.
Standardized testing protocols ensure purity and potency measurements are comparable across suppliers and time periods. The most common standards are USP and Ph.Eur monographs, which specify exact procedures for peptide analysis. When evaluating a new supplier, ask whether testing follows USP or Ph.Eur protocols. If they use proprietary methods, ask for validation data showing correlation with standard protocols.
Batch verification is critical for long-term studies or multi-site collaborations. Request that each batch be tested independently and that you receive raw data (chromatograms, mass spectra), not just summary numbers. This allows you to verify consistency and catch problems early.
Navigating the difference between peptide purity and potency requires understanding that these metrics measure fundamentally different aspects of quality. High purity confirms chemical identity; high potency confirms biological function. For research depending on reproducible results, both matter. Comprehensive analytical documentation including HPLC chromatograms, impurity profiles, and potency data allows you to verify material quality independently and troubleshoot with confidence when results don’t align with expectations.
Peptide purity refers to the percentage of the target peptide versus contaminants and impurities in a sample, measured through HPLC and mass spectrometry. Potency measures the biological activity or functional effectiveness of the peptide, how well it performs its intended action. A peptide can be highly pure but have low potency if it's degraded, or moderately pure but highly potent if impurities don't interfere with its mechanism. Both metrics are essential for research-grade peptides.
HPLC (High-Performance Liquid Chromatography) separates peptide components based on their chemical properties as they move through a column. The technique measures retention time (how long each component stays in the column) and peak area (the size of each component's signal). The target peptide's peak area is divided by the total peak area of all components to calculate purity percentage. This provides an impurity profile showing contaminants, degradation products, and synthesis byproducts.
A high purity percentage doesn't account for net peptide content, the actual amount of active peptide in the sample. Excipients, water, solvent residues, and buffer components can inflate the total mass without contributing to biological activity. For example, a peptide listed at 95% purity might contain only 70% actual peptide if 25% is water weight. Always check the Certificate of Analysis for net peptide content and the assay method used to ensure you're getting the active peptide concentration your research requires.
Review the HPLC chromatogram showing the impurity profile and peak identification. Check the assay percentage (the actual active peptide content), not just purity percentage. Look for endotoxin levels if required for your application, sequence verification via mass spectrometry, and batch consistency data. Verify that testing followed standardized protocols and that the Certificate includes retention time data, peak area calculations, and identification of major contaminants. Reputable suppliers like Canada BioGenix provide comprehensive CoAs with all these details.
This article was written using GrandRanker